
Company
🏦 Santander
Skill Area
UX & CRO
Tool Stack
Google Optimize (defunct)Google AnalyticsGoogle Tag ManagerHTML/CSSJS
Overview
🔍 Context | Led the launch of CRO program for Santander's website with aim to test key landing pages, calculator widgets in NL and BE with overseeing winning variants implementation in the Umbraco CMS of the site |
💬 Challenges | • Meeting AFM (Dutch Financial Markets Authority) compliance while optimizing conversion
• Balancing aggressive lead volume targets with responsible lending practices
• Exploring data from various touchpoints of the long user journey (leading to loan contract signing as end conversion) to draw most likely conclusions
• Coordinating multiple stakeholders across business, legal & compliance, and external development teams |
Process Highlights
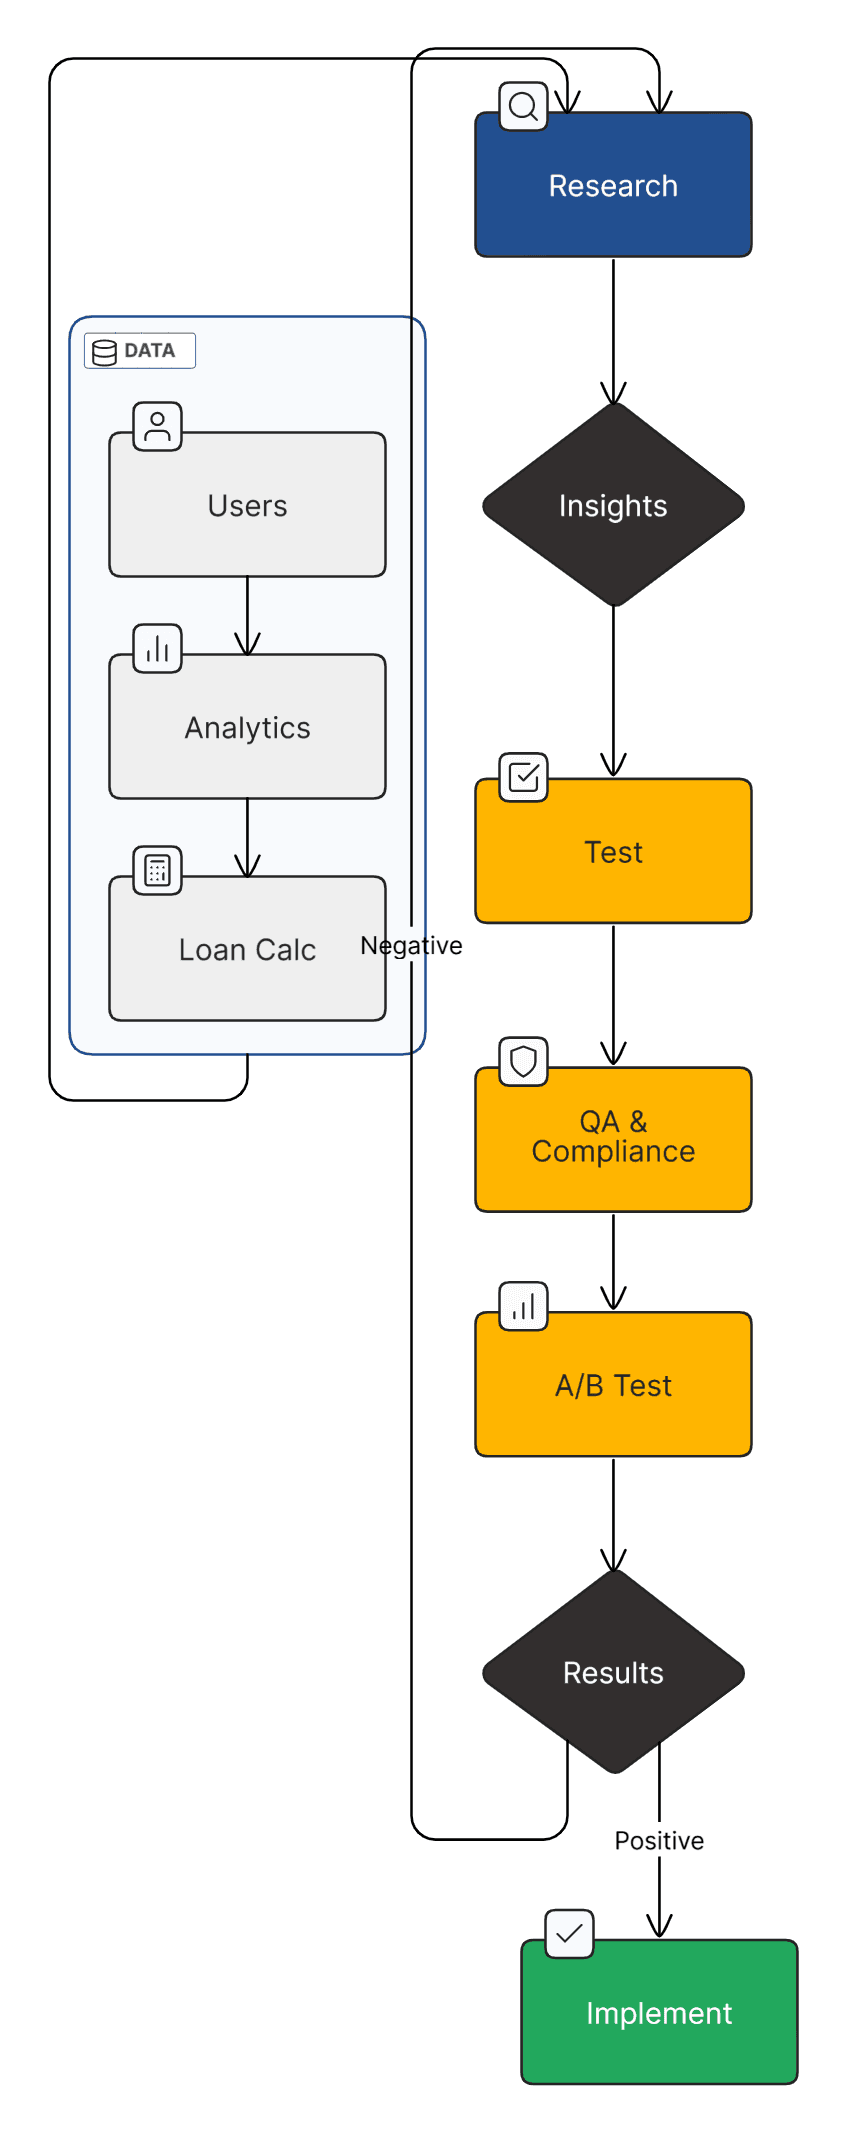
Iterative Process
- Research Phase - Data collection: Multi-channel data collection through:
- Custom event tracking on loan calculator interactions
- Hotjar heatmaps and session recordings
- Targeted customer surveys via e-mails
- Google Analytics data
- Test Hypothesis: Hypothesis-driven experiments based on research insights:
- Applying UX principles (e.g. Fogg Behaviour Model) to data observed across various points of user journey
- Using cognitive bias frameworks to identify friction points in the application process
- Leveraging heatmap data to optimize element placement and visual hierarchy
- Implementing Jobs-to-be-Done (JTD) theory to align user goals with conversion paths
- Creating user personas based on behavioral analytics to target specific friction points
- Test development and QA:
- QA for all test implementations (with development done by agency)
- Internal compliance approval
- Launch of experiments in Google Optimize, with 30-60 day windows and relevant primary/secondary KPIs set up depending on the nature of experiment
- Final Implementation:
- Implementation of winning variants that showed uplifts
- Conducted statistical analysis to validate results, taking into account both upper and lower funnel with variable conversion windows
- Presented findings to cross-functional stakeholders to continuously justify and raise the budget allocated to CRO activities and improve overall customer understanding
Visualization
Performance highlights
CRO program stats
- Test velocity: 2-3 experiments per month across key pages
- Success rate: 60% of experiments produced winning variants
- Survey responses: Typically 200-1000 responses per test, which were analyzed using a variety of qualitative research methodologies
- All tests achieved 95%+ statistical confidence with 45-day test cycles
High-Impact Wins
- Simplified calculator flow reduced abandonment by 28%
- Homepage redesign delivered 22% conversion uplift
- Mobile UX optimizations significantly improved mobile performance